Interpolating data with Python
So as usual for this time of year I find myself on vacation with very little to do. So I try and find personal projects that interest me. This is usually a mixture of electronics and mucking around with software in a way that I don't usally find the time for normally. One of projects is my sensor network.
I have a number of Raspberry Pi's around my house and garden that take measurements of temperature, humidity, pressure and light. They hold the data locally and then periodically upload them to a central server (another Raspberry Pi) where they are aggregated. However for any number of reasons (usally a power failure) the raspberrypi's occasionally restart and are unable to join the network. This means that some of their data is lost. I've improved their resiliance to failure and so it's a less common occurance but it's still possible for it to happen. When this means I'm left with some ugly gaps in an otherwise perfect data set. It's not a big deal but it's pretty easy to fix. Before I begin, I acknolwedge that I'm effectively "making up" data to make graphs "prettier".
In the following code notebook I'll be using Python and Pandas to tidy up the gaps.
To start with I need to load the libraries to process the data. The important ones are included at the start of the imports. The rest from "SensorDatabaseUtilities" aren't really relevant since they are just helper classes to get data from my repository
import matplotlib.pyplot as plt
from matplotlib import style
import pandas as pd
import matplotlib
import json
from pandas.io.json import json_normalize
# The following imports are from my own Sensor Library modules and aren't really relevant
from SensorDatabaseUtilities import AggregateItem
from SensorDatabaseUtilities import SensorDatabaseUtilities
# Make sure the charts appear in this notebook and are readable
%matplotlib inline
matplotlib.rcParams['figure.figsize'] = (20.0, 10.0)
The following function is used to convert a list of JSON documents (sensor readings) into a Pandas DataFrame. It then finds the minimum and maximum dates and creates a range for that period. It uses this period to find any missing dates. The heavy lifting of the function uses the reindex() function to insert new entries whilst at the same time interpolating any missing values in the dataframe. It then returns just the newly generated rows
def fillin_missing_data(sensor_name, results_list, algorithm='linear', order=2):
    # Turn list of json documents into a json document
    results = {"results": results_list}
    # Convert JSON into Panda Dataframe/Table
    df = json_normalize(results['results'])
    # Convert Date String to actual DateTime object
    df['Date'] = pd.to_datetime(df['Date'])
    # Find the max and min of the Data Range and generate a complete range of Dates
    full_range = pd.date_range(df['Date'].min(), df['Date'].max())
    # Find the dates that aren't in the complete range
    missing_dates = full_range[~full_range.isin(df['Date'])]
    # Set the Date to be the index
    df.set_index(['Date'], inplace=True)
    # Reindex the data filling in the missing date and interpolating missing values
    if algorithm in ['spline', 'polynomial'] :
        df = df.sort_index().reindex(full_range).interpolate(method=algorithm, order=order)
    elif algorithm in ['ffill', 'bfill']:
        df = df.sort_index().reindex(full_range, method=algorithm)
    else:
        df = df.sort_index().reindex(full_range).interpolate(method=algorithm)
    # Find the dates in original data set that have been added
    new_dates = df[df.index.isin(missing_dates)]
    # Create new aggregate records and insert them into the database
    # new_dates.apply(gen_json,axis=1, args=[sensor_name])
    return new_dates
This function simply takes an array of JSON documents and converts them into a DataFrame using the Pandas json_normalize function. It provides us with the dataset that contains missing data i.e. an incomplete data set.
def json_to_dataframe(results_list):
    # Turn list of json documents into a json dodument
    results = {"results": results_list}
    # Convert JSON into Panda Dataframe/Table
    df = json_normalize(results['results'])
    return df
The first step is to pull the data from the database. I'm using some helper functions to do this for me. I've also selected a date range where I know I have a problem.
utils = SensorDatabaseUtilities('raspberrypi', 'localhost')
data = utils.getRangeData('20-jan-2015', '10-feb-2015')
# The following isn't need in the code but is included just to show the structure of the JSON Record
json.dumps(data[0])
Next simply convert the list of JSON records into a Pandas DataFrame and set it's index to the "Date" Column. NOTE : Only the first 5 records are shown
incomplete_data = json_to_dataframe(data)
# Find the range of the data and build a series with all dates for that range
full_range = pd.date_range(incomplete_data['Date'].min(), incomplete_data['Date'].max())
incomplete_data['Date'] = pd.to_datetime(incomplete_data['Date'])
incomplete_data.set_index(['Date'], inplace=True)
# Show the structure of the data set when converted into a DataFrame
incomplete_data.head()
The following step isn't needed but simply shows the problem we have. In this instance we are missing the days for Janurary 26th 2015 to Janurary 30th 2015
#incomplete_data.set_index(['Date'], inplace=True)
problem_data = incomplete_data.sort_index().reindex(full_range)
axis = problem_data['AverageTemperature'].plot(kind='bar')
axis.set_ylim(18,22)
plt.show()

Pandas offers you a number of approaches for interpolating the missing data in a series. They range from the simple method of backfilling or forward filling values to the more powerful approaches of methods such as "linear", "quadratic" and "cubic" all the way through to the more sophisticated approaches of "pchip", "spline" and "polynomial". Each approach has its benefits and disadvantages. Rather than talk through each it's much simpler to show you the effect of each interpolation on the data. I've used a line graph rather than a bar graph to allow me to show all of the approaches on a single graph.
interpolation_algorithms = ['linear', 'quadratic', 'cubic', 'spline', 'polynomial', 'pchip', 'ffill', 'bfill']

fig, ax = plt.subplots()
for ia in interpolation_algorithms:
    new_df = pd.concat([incomplete_data, fillin_missing_data('raspberrypi', data, ia)])
    ax = new_df['AverageTemperature'].plot()

handles, not_needed = ax.get_legend_handles_labels()
ax.legend(handles, interpolation_algorithms, loc='best')

plt.show()

Looking at the graph it appears that either pchip (Piecewise Cubic Hermite Interpolating Polynomial) or Cubic interpolation is going to provide the best approximation for the missing values in my data set. This is largely subjective because these are "made up values" but I believe either of these approaches provide values that are closest to what the data could have been.
The next step is to apply one to the incomplete data set and store it back in the database
complete_data = pd.concat([incomplete_data, fillin_missing_data('raspberrypi', data, 'pchip')])

axis = complete_data.sort_index()['AverageTemperature'].plot(kind='bar')
axis.set_ylim(18,22)
plt.show()

And thats it. I've made the code much more verbose that it needed to be purely to demonstrate the point. Pandas makes it very simple to patch up a data set.
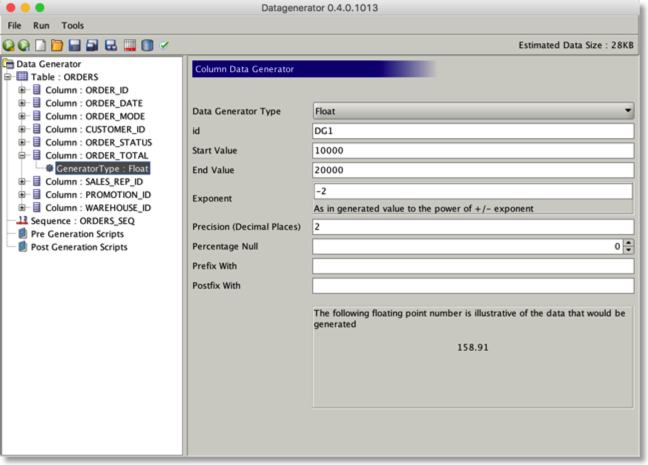
A new build of Datagenerator
I've had to update Datagenerator extensively to support some of the new benchmarks and changes that the next version of swingbench requires. Some of the changes I've made are.
Support for a new generator to create arbitrary precision floating point values. It also includes a preview of the data to be generated. This will become the standard moving forwards.
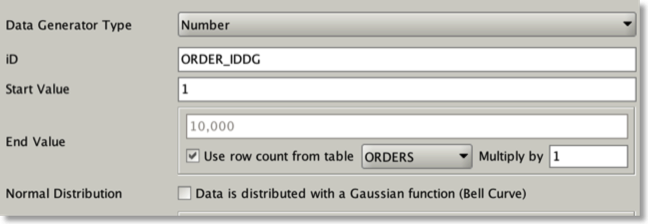
Number generators can use the row count of another table to act as the end value. This makes it simple and quick to create foreign keys.
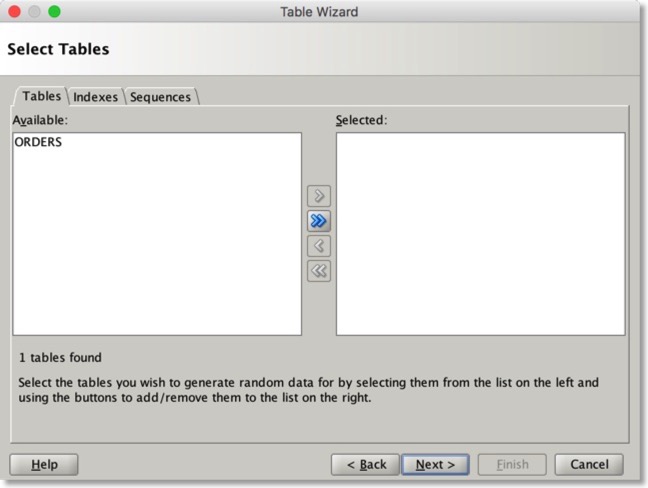
Reverse Engineering now supports Index and sequences. The reverse engineering process also uses the statistics from tables to seed the generators.
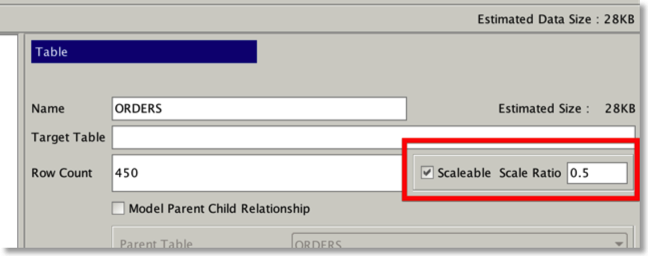
Tables can be scaled at different ratios from others…
Also upcoming in the 0.5 build…
- Generators based on values from other generators i.e. use the "first_name" created by another generator to act as part of an email address.
- UID Generator
- Potentially generators for ZIPCodes, IP Ranges, Points within Polygons.
You can download it as always from here
ORDS From : Start to Finish
Introduction
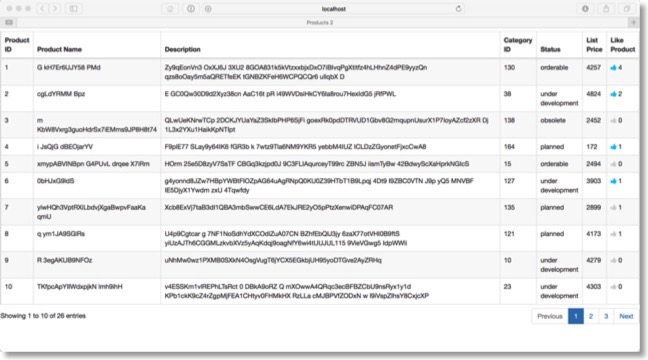
This is likely to be a pretty long posting on ORDS to describe the workflow for creating a REST application from start to finish. With that said I'm going to have to make a few compromises to keep it tolerable to follow. I thought long and hard about what would be a meaningful example that would be easy to understand but show most of the aspects of building a REST based application using Oracle ORDS. With this in mind I settled on a simple micro service to enable users to "like" products/rows in a similar fashion to being able to like posts on Facebook/Twitter or other social media networks. Whilst there are plenty of examples of how to do this out there already I couldn't find many that explained the entire process from start to finish and using the Oracle Database as the target. I'll try and keep it up to date as we are expecting to see a few changes in SQLDeveloper and ORDS shortly. On completion we should have a web page that looks a little like the one below.
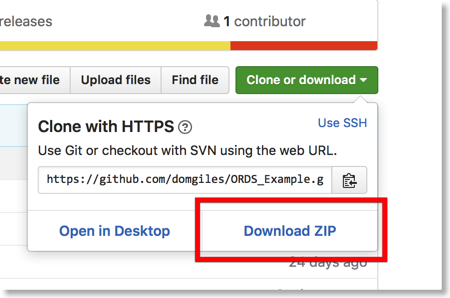
The code for this blog is maintained here
To create a working environment simply go to the link above, click on the "Clone or download" button and then click on the "Download ZIP" link. When it's finished downloading uncompress the file into your preferred location.
This post should largely serve as a reference for those wishing to test out this functionality themselves. I'll also be releasing a version of this code where we store JSON in the database as opposed to relational table to offer a comparison with the approach.
ORDS Description
First of all what is ORDS and why do we care. Well this is Oracle's description
"Oracle REST Data Services (ORDS) makes it easy to develop modern REST interfaces for relational data in the Oracle Database and now, with ORDS 3.0, the Oracle Database 12c JSON Document Store and Oracle NoSQL Database. ORDS is available both as an Oracle Database Cloud Service and on premise.
REST has become the dominant interfaces for accessing services on the Internet, including those provided by major vendors such as Google, Facebook, Twitter, and Oracle, and within the enterprise by leading companies throughout the world. REST provides a powerful yet simple alternative to standards such as SOAP with connectivity to virtually every language environment, without having to install client drivers, because it is based on simple HTTP calls which virtually all language environments support.
For relational data, ORDS 3.0 now automatically generates REST endpoints for about a dozen major single table operations including create, query, update, and delete. Easy to write JSON filters allow query predicates and sorts to be specified in a query-by-example format. For more complex operations, REST calls are mapped to SQL and PL/SQL routines you can write which return data in JSON and other formats.
ORDS 3.0 enables a wide range of operations to be performed on JSON documents in the Oracle Database 12c Document Store using the Simple Oracle Document Access (SODA) API over REST. These operations include create, query, update, and delete with support for JSON filters."
With that said lets get started.
Prerequisites
If you plan to install this example you'll need to have the following components available. I won't be describing their installation. I'll assume you'll have done this ahead of time
- Oracle Database (SE or EE) 11.1 or later. Oracle Database 12c is the preferred version. It can be configured either as a PDB or not. You can download it from here
- Oracle SQL Developer 4.1.3. It needs to be at least this version. You can down load it here
- Oracle ORDS 3.0.6. You can download it here. (NOTE : I will walkthrough this installation later in the document)
- A Java Virtual Machine on the server/laptop/VM you are running the example on. I'd recommend Java 8 available here
- Alternatively you could download a Virtual Box VM such as the "Hands-on Database Application Development" VM from here.Which will provide everything you need in a ready configured package.
I'm also going to assume that you'll be running on a unix type OS (Linux, Mac OS, Solaris, AIX). Although this will also work fine on windows (just need to convert some of the commands).
My setup
For my setup I have the following configuration.
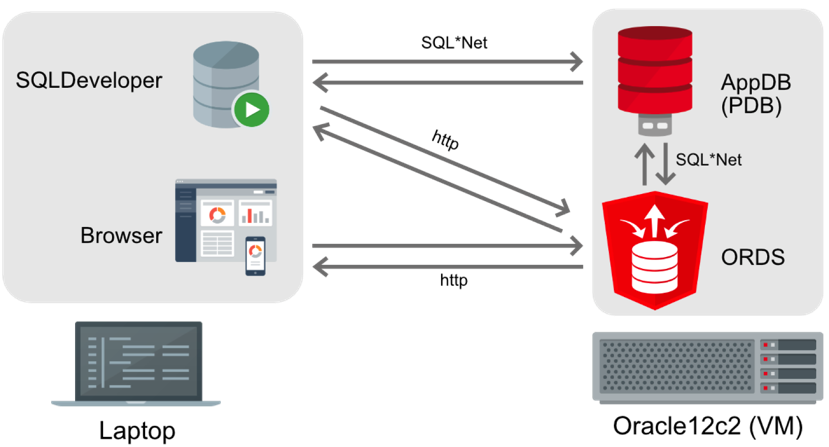
In reality everything is running on my workstation but the the diagram above provides a working model
Install of ORDS
Assuming you aren't going down the pre installed Virtual Box VM mentioned in the previous section. The install of ORDS is very simple. After you've downloaded it to your VM/Server/Laptop all you need to do is unzip it and change into the directory . i.e.In the directory you unzipped the download run ORDS. The first time you run this it will lead you through the install asking you for the connection to the database. I'd recommended skipping configuring APEX at this stage (by selecting 2 when asked) and running ORDS using http. Whilst these options might not be ideal for production environments they will enable you to get started.
After this completes hit control-c to exit the program. At this stage you should probably add a user with SQLDeveloper development support. I've named mine "appdev" but any name would be fine. We'll use this user later in the example. You can do this using the following command and supplying passwords.
And then restart ORDS. This time it won't prompt you for any passwords but simply run in the foreground
Thats all thats needed to install ORDS.
Install Database Tables
The next step is to create a user and tablespace to hold the tables. I've provided a simple script "create_user.sql" that will create a database user "SOE" and tablespace "SOE" to run it simply connect to the database with a user with DBA privilege. (NOTE : This could also be done inside of SQLDeveloper)
The script creates a user "soe" and and tablespace "soe" and then grants the user access to the tablespace. It finishes off by granting the user enough privileges to create tables, views and procedures
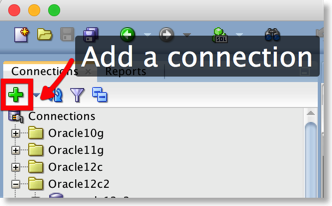
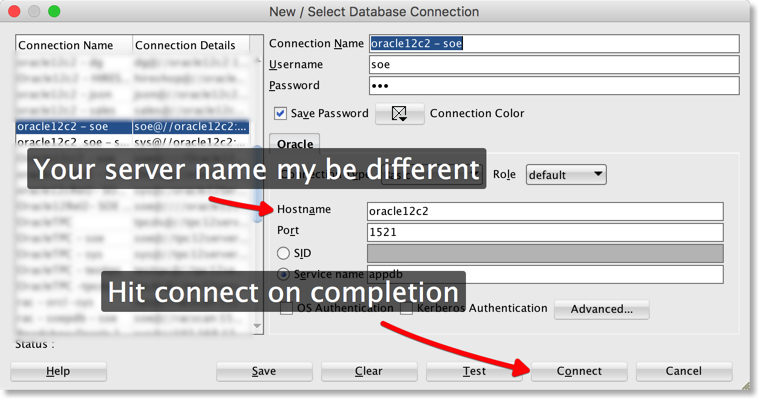
At this stage it's worth starting SQLDeveloper where the bulk of the work will be done. You'll need to create a connection to the Database .You'll do this from the connections tab as show below.
Then fill in the details and hit connect
The next step is to create the example tables and test data. I've provided a simple script "create_tables.sql to do this for you. It will create one to hold the "product_information" that would be typically part of and existing application and other to hold the likes. This table is called "user_likes".
The "USER_LIKES" table is an Index Organised Table. Whilst the trivial amount of data we holding in this example won't benefit from his approach it would likely have an impact on production scale workloads. The script will insert a few sample rows as well.
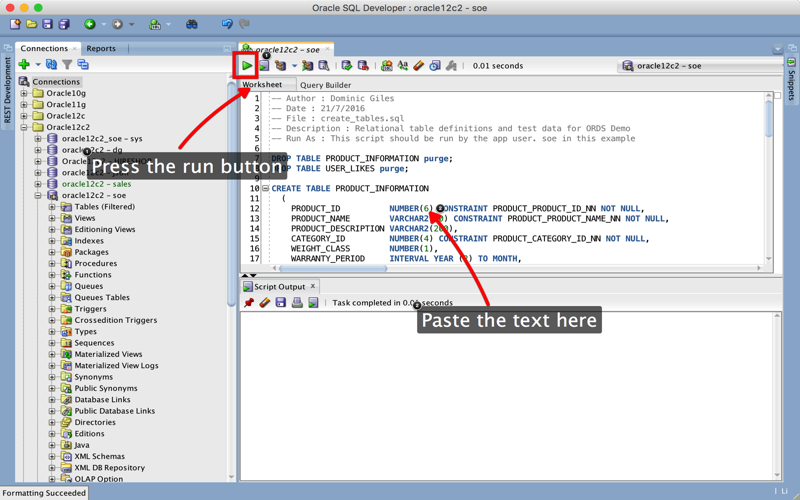
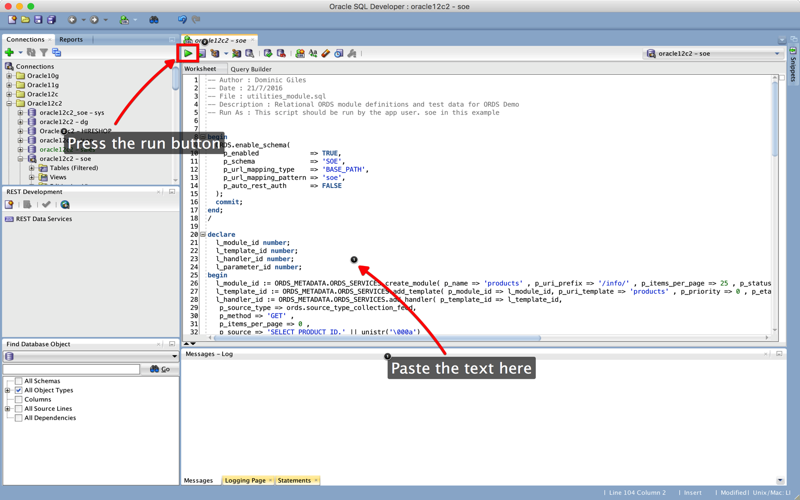
To run this script copy and paste the SQL into the SQLDeveloper
Install REST Service Application Code
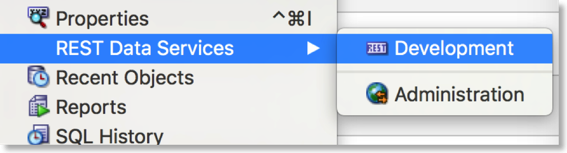
At this point we'll connect to ORDS from SQLDeveloper. You'll be using the username you used during the installation of ORDS. In my case this was "appdev". From the menu you'll need to view "REST Data Services" and select the "Development" option as shown below
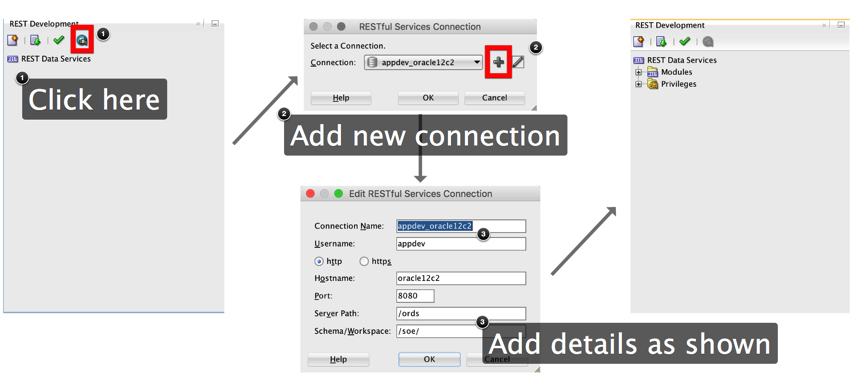
This will launch the REST development UI (by default on the left hand side of the screen) as shown below. Add a new connection and fill in the details as shown i.e. Server Path = "/ords" and Schema Workspace = "/soe/".
The next step is to run a script "utilities_module.sql" which will enable the schema to support ORDS and create the ORDS modules used by the application. This is purely for convenience. I'll describe the process of creating one of the modules in a blog shortly after this one. To install the REST modules simply copy and paste the code below into the SQLDeveloper session you've already created.
As shown below
After this script completes we can then download the modules into SQLDeveloper from ORDS's repository. The reason we need to do this is that we've simply imported the data into the ORDS repository and not made it visible to SQLDeveloper at this point. To achieve this all we need to do is
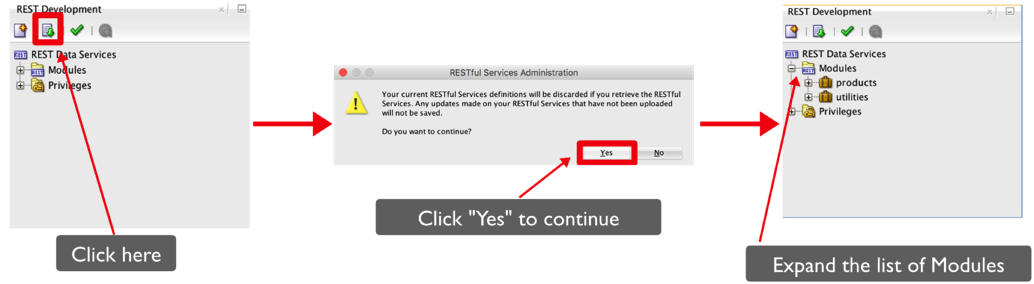
This will display the modules we created by running the script. The two modules are
- Products : This will simply retrieve the rows from the PRODUCTS table. It's not really necessary to explicitly declare this module as ORDS base functionality already has a REST API that could be used instead.
- Utilities : This module contains three templates or services we can call to like a row in a table
- get likes : Gets the total number of likes of a row by all users and the user specified in the parameter
- like : Enables you to like a row if you haven't already
- unlike : reverses a like operation by the user specifed if he's liked it before
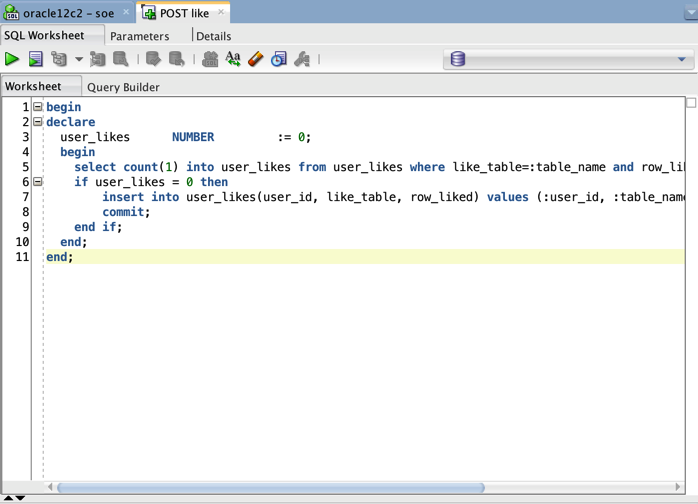
The first tab list the SQL or PL/SQL that will implement the business logic. In this particular example we are using PL/SQL to first check if a user has liked a row by checking first the USER_LIKES table. If they haven't already liked the row we insert a new one and commit the transaction.
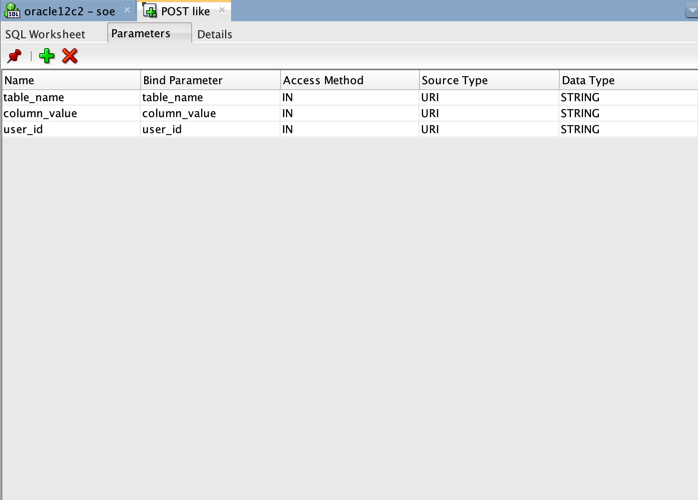
The next tab lists the parameters that are passed to our logic or SQL statement. In our particular example we are passing three parameters that tell the procedure the table that is being liked, the unique identifier for the row (in our simple case it's assumed to be a string but could as equally be a rowid or number) and the user identifier (typically application specific but we'll assume it's something like an email).
The final tab summarises some of the settings for the service and provides you with a url to call to test the service.
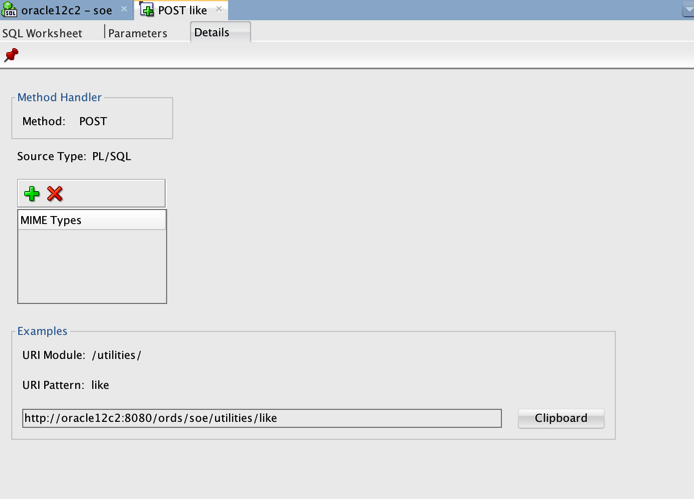
You can test most "GET" REST calls pretty trivially within a browser put it takes just a little bit more for POST, PUT and DELETE. To test the POST call shown in the screen shot above we are going to use a command line utility called curl (installed by default on linux and MacOS). We'll also use a file that contains the json we want to send to the REST service. This file is called "test.json" and has the following contents
To call the REST service all we need to do is issue the following command
Obviously substitute the name of your server in the code. You should get a HTTP return code of 200. Indicating that the code successfully ran.
We can also test the GET REST call that returns the "like" we just made using the following command
You should get a small JSON snippet with the number of likes by everybody and the user "dominic.giles"
Calling the REST Services from a web page
Now that we've got the services up and running we can use a simple web page that displays all of the rows from the PRODUCT_INFORMATION table with a "thumb" to enable us to like the row. Like all of the code used in this blog you can find them all on my github repository.Let me start by saying that the web page we are going to create is a very simple example and would normally require a lot more validation and error handling before it would ever be considered for a production environment.
The web page we'll put together uses JQuery and a javascript library called "DataTables" (link here). However it's important to point out that implementing this functionality doesn't require these tools. It could have been as easily achieved using Oracle Application Express or a framework like Jet. But to simplify things this approach allows us to minimise the steps required and reduce the amount of moving parts.
The final app should look like this
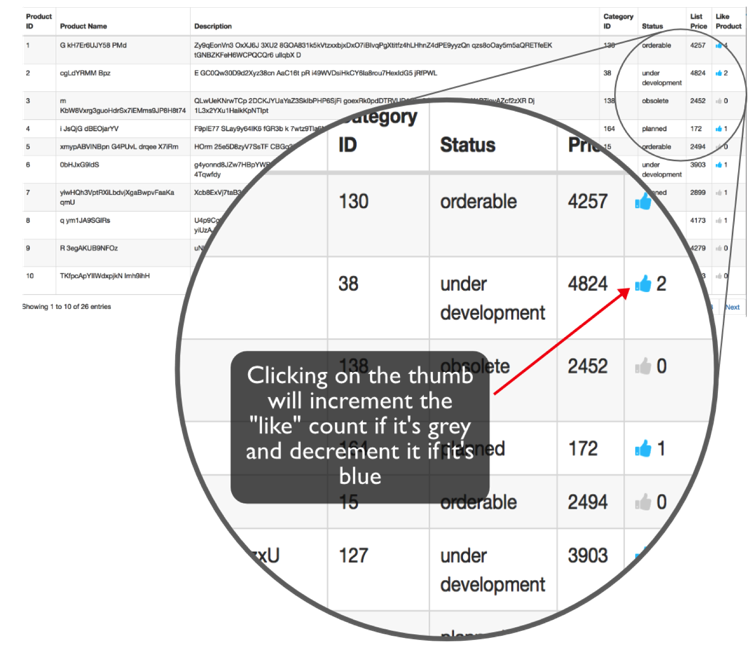
When the form is first loaded the javascript calls the "GetLikes" REST service (once for each row displayed) which asynchronously returns the total count of "likes" a product has received and sets the colour of the them dependent on whether the current user has liked it. It will stay grey if the current user hasn't liked it and turn blue if they have. On clicking on a thumb the javascript checks whether the user has previously like it. If they haven't it calls the "Like" REST Call and call the "Unlike" REST call if they have.
The code is made up broken up into two files. One containing the HTML and the other the containing the javascript.
And the javascript
This really isn't the place to go into all of the details of the code but there are one or two things that are worth pointing out. The first is at the start of liketable.js file. You'll need to change the following entries to reflect your own environment. It's likely you'll only need to change the "hostport" variable to start with. The username is hardcoded in this example but in the real world it would be derived from the system context.
var $userName = 'dominic.giles';
var $tableName = 'product_information';
var $hostport = 'http://oracle12c2:8080';
var $uniqueIDColumn = "product_id";
The other piece of code worth looking at is the calls to the REST service. The code below uses the javascript ajax functionality to make an asynchronous call to ORDS which with then return the JSON response.
function getRowLikes(un, tn, rID) {
    var likeResult = $.ajax({
        url: $hostport + "/ords/soe/utilities/getlikes?table_name=" + tn + "&column_value=" + rID + "&user_id=" + un,
        type: "GET"
    });
    return likeResult;
}
Likewise the following shows the AJAX call to the like function. This call unlike the the previous one is performed synchronously but follows the same principals.
function likeRow(un, tn, rID) {
    $.ajax({
        url: $hostport + "/ords/soe/utilities/like",
        type: "POST",
        data: {"table_name": tn, "column_value": rID, "user_id": un},
        async: false
    });
}
Once you've made the changes to the hostname variable you should be able to open a browser and open the products.html file within it.
Over the coming days I'll knock up a little screen cast to accompany this blog.
Testing a new build of swingbench
The problem I had this time around was I made a "quick fix" a couple of years ago to a section of the code that creates the various snapshots of data during a timed run. I always meant to come back and fix this "quick fix" when I found the time… Anyway, fast forward to October last year and I added some code that created "percentiles" for reporting for simple and full stats collection. This lead to some behaviour on the stats collection that created a near impossible to debug "concurrent modification exception". The only solution was to painstakingly go through all of the threaded code to find the issue. It turns out that the "quick fix" I made created a sublist of a section of the data structure as a "view" instead of a new copy. An amateurish mistake to make but I guess not uncommon if you maintain the code in the way I do….
So what I'm looking for is some volunteers to check that the code works as expected.
You can find the new build of the code here. You'll need Java 8 on the machine you're installing it on.
The steps needed to test the problem code are…
- Unzip the swingbench zip file (swingbenchtest.zip)
- Change into the bin directory (on Linux/Unix) or winbin directory (on windows)
- Create a new swingbench schema using oewizard or shwizard. This will walk you through the install against your database (11.2 or 12.1)
- Start up swingbench or charbench…
- Set and test the connection to the database that you ran oewizard against
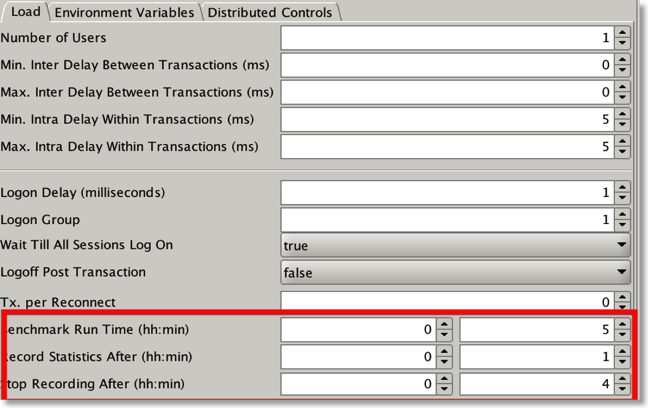
- Set the Benchmark run time to a value i.e. 10mins,
- Set the start record statistics to a value i.e. 2mins
- Set the stop record statistics to a value i.e. 8mins
- Start the benchmark run
- When it finished check that stats/xml has been created in the output tab.
Alternatively do this in charbench with a command like
./charbench -cs //oracleserver/orcl -u soe -p soe -uc 100 -rt 0:10 -bs 0:02 -be 0:08
This should generate a results file in the directory you started it from.
Appreciate the time and effort for helping me out…
Alongside the fix to this difficult build I've also included the additional functionality in this build
- Percentiles are now created for both "simple" and "full" stats collection
- You can now specify "rt", "bs" and "be" in fractions of a second i.e. 0:00.30 (30 seconds). Previously is had a granularity of minutes
- An initial JSON in the database benchmark framework has been created.