2014
PDF Generation of report files
27/11/14 21:21 Filed in: Python
I finally got round to adding some code that creates pdf files such that you can convert the “XML” result files into something more readable. However this new functionality requires a Java8 VM to work. You can download the latest build here.
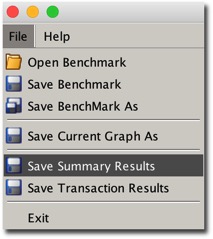
All you need to do is to run swingbench and from the menu save the summary results.
Minibench and charbench will automatically create a results config file in the local directory after a benchmark run. The file that’s created will typically start with “result” and it should look something like this.
[bin]$ ls ccwizard.xml coordinator oewizard shwizard.xmlbmcompare charbench data oewizard.xml swingbenchccconfig.xml clusteroverview debug.log results.xml swingconfig.xmlccwizard clusteroverview.xml minibench shwizardAll you need to do after this is to run the “results2pdf command
[bin]$ ./results2pdf -c results2pdf
There’s really only 2 command line options
[bin]$ ./results2pdf -husage: parameters: -c the config file to convert from xml to pdf -debug send debug information to stdout -h,--help print this message -o output filenameThey are for the input file (-c) and the output file (-o).
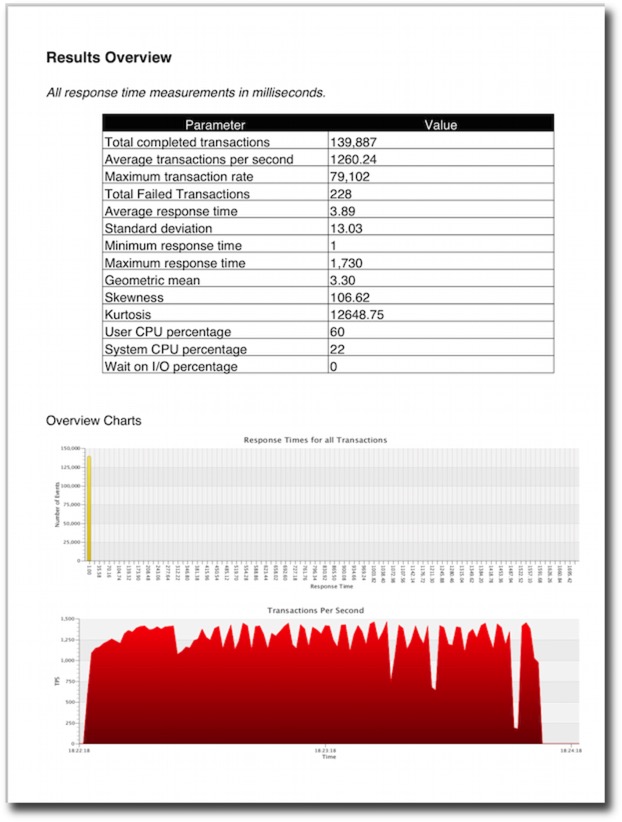
The resultant file will contain tables and graphs. The type of data will depend heavily on the type of stats collected in the benchmark. For the richest collection you should enable
An example of the output can be found here.
I plan to try and have the resultant pdf generated and displayed at the end of every bench mark. I’ll include this functionality in a future build.
All you need to do is to run swingbench and from the menu save the summary results.
Minibench and charbench will automatically create a results config file in the local directory after a benchmark run. The file that’s created will typically start with “result” and it should look something like this.
[bin]$ ls ccwizard.xml coordinator oewizard shwizard.xmlbmcompare charbench data oewizard.xml swingbenchccconfig.xml clusteroverview debug.log results.xml swingconfig.xmlccwizard clusteroverview.xml minibench shwizardAll you need to do after this is to run the “results2pdf command
[bin]$ ./results2pdf -c results2pdf
There’s really only 2 command line options
[bin]$ ./results2pdf -husage: parameters: -c
The resultant file will contain tables and graphs. The type of data will depend heavily on the type of stats collected in the benchmark. For the richest collection you should enable
- Full stats collection
- Database statistics collection
- CPU collection
An example of the output can be found here.
I plan to try and have the resultant pdf generated and displayed at the end of every bench mark. I’ll include this functionality in a future build.
Comments
Application Continuity in Oracle Database 12c (12.1.0.2)
19/11/14 13:53 Filed in: SwingbenchOracle 12c
In this entry I’ll try and detail the steps required to get application continuity working with swingbench. I’ll create a video with a complete walk through of the build. It’s also possible this blog is likely to be updated regularly as I get feedback
The following assumptions are made
In this example I’m using a 2 node RAC cluster for simplicity but I’ve validated the configuration on an 8 node cluster as well. My configuration
OS : Linux 6
Nodes : RAC1, RAC2
SCAN : racscan
CDB : orcl
PDB : soe
schema : soe
So after you’ve confirmed that the soe benchmark has been installed correctly the next step is to define the services. I created two new ones to show the difference between Application Continuity and standard Fast Application Failover. First a non Application Continuity Service
Now a service defined for Application Continuity
Then grant access to the Application Continuity package to the SOE use
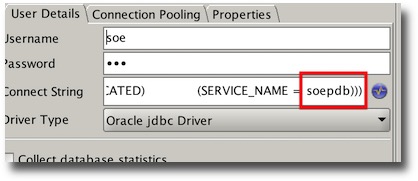
And thats it for the database/grid. All we need to do now is to configure swingbench to connect to the services. You can do this either in the command line, swingbench GUI or by editing the config file. The connect string should look similar to this (for application continuity)
NOTE : EZConnect strings won’t work for this.
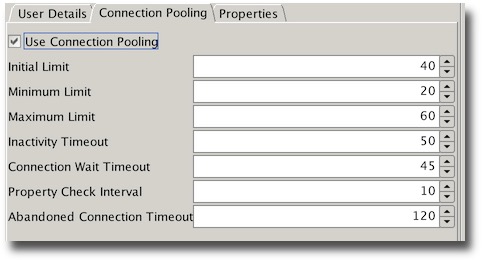
We’ll also need to use connection pooling. The pool definition is only example and should reflect the total number of threads you plan to run with. If you’ve edited the definition in the config file you should end up with something similar to
Or if you modify it via the GUI.
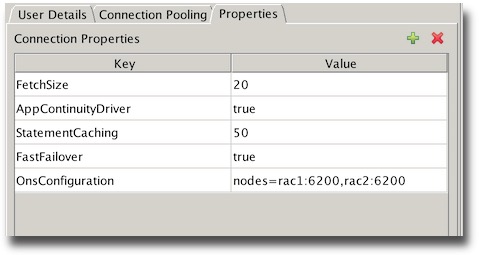
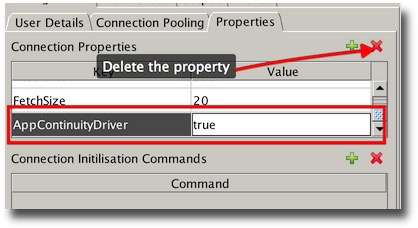
The final step is to enable the application continuity driver and FAN you can again do this in the config file with the following settings
or via the GUI
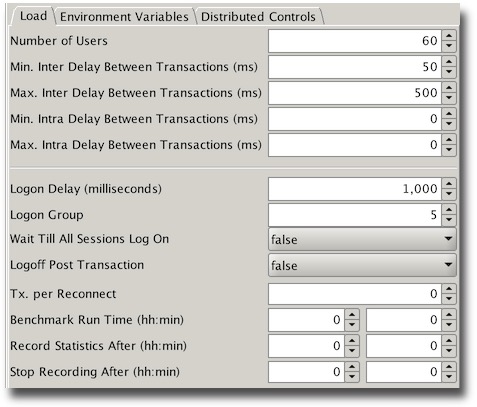
For my test I used the following Load configuration
Or via the GUI
My complete config file is available here for reference
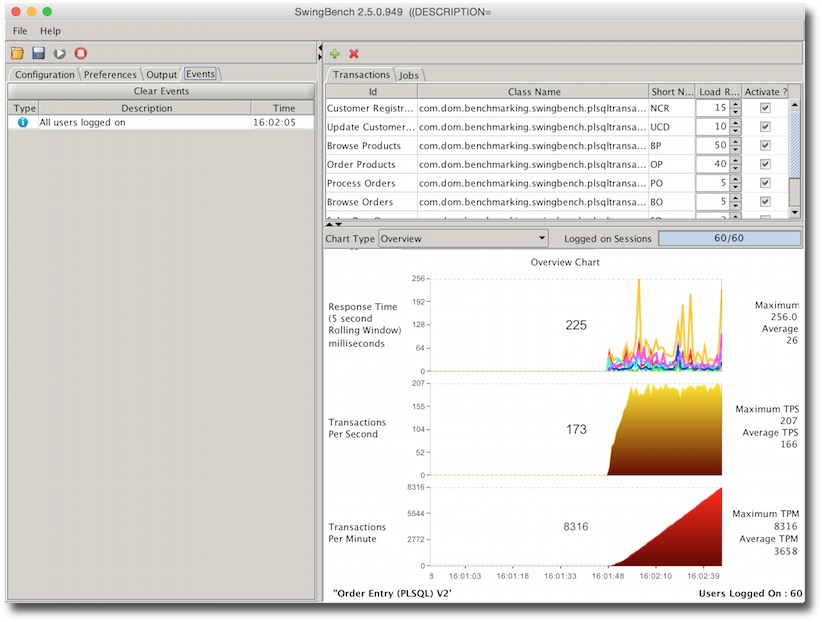
I’d initially suggest running with swingbench to enable the monitoring of errors. Start swingbench
You should see a balanced number of users logged on across your instances. Although though may fluctuate depending on a number of factors.
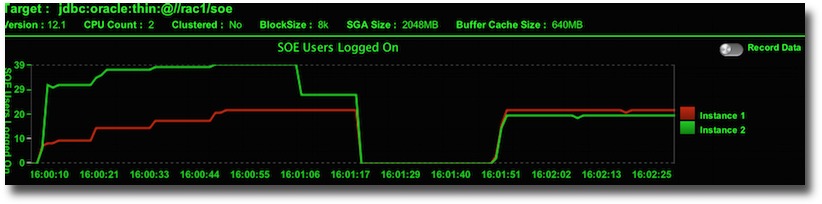
The next step is to cause an unexpected termination of one of the resources. I’d suggest killing PMON i.e.
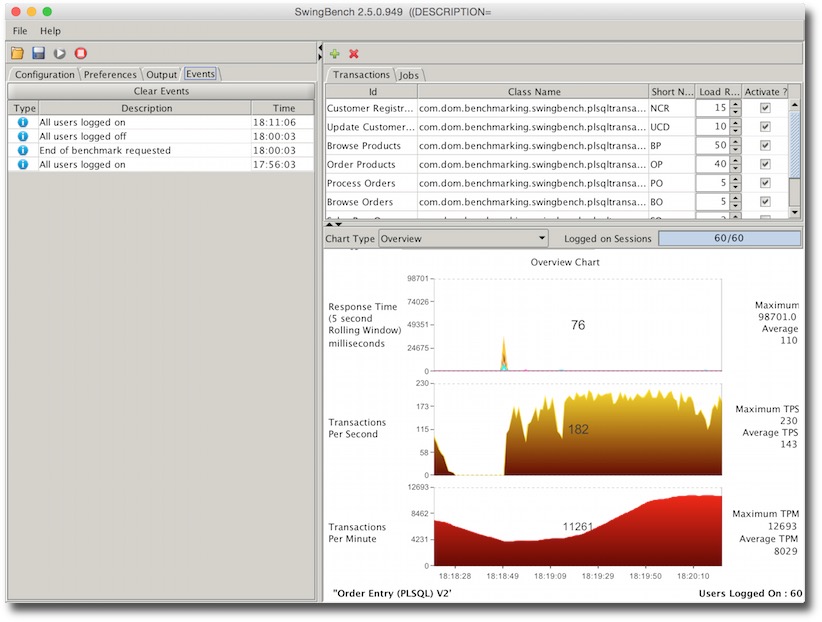
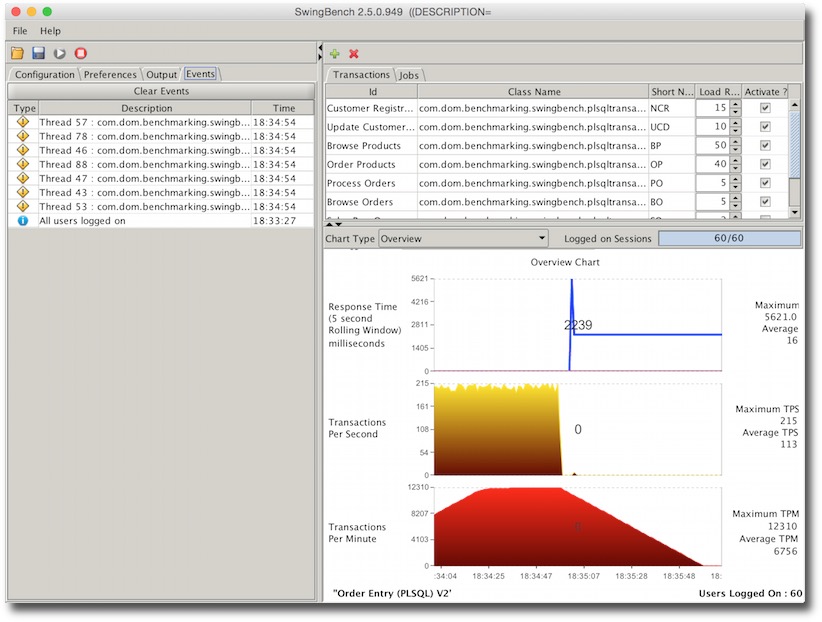
You should see a little disruption in the TPS as you kill the instance. How long will depend on your RAC configuration and power of machine. The following screen shot is from 2 VMs running on my mac. But the important point is that swingbench won’t get any errors.
To try and see what happens without application continuity try changing the connect string to point at the non application continuity service.
Then delete the property that forces swingbench to use the Application Continuity Driver.
Rerunning and terminating the instance should result in something like this.
The important point here is the errors which normally an application developer would need to handle without the guarantee of transactions not being applied more than once.
Assumptions
The following assumptions are made
- You have a working Oracle RAC Database 12c ideally running at version 12.1.0.2 (Database and Clusterware)
- You have downloaded the very latest version of swingbench
- You’ve installed the SOE benchmark using the oewizard
- You’re running on a Physical or Virtual Machine (Virtual Box)
- You are using the thin jdbc driver with swingbench
My configuration
In this example I’m using a 2 node RAC cluster for simplicity but I’ve validated the configuration on an 8 node cluster as well. My configuration
OS : Linux 6
Nodes : RAC1, RAC2
SCAN : racscan
CDB : orcl
PDB : soe
schema : soe
So after you’ve confirmed that the soe benchmark has been installed correctly the next step is to define the services. I created two new ones to show the difference between Application Continuity and standard Fast Application Failover. First a non Application Continuity Service
srvctl add service -d orcl -s soepdb -pdb soe -preferred orcl1,orcl2
srvctl modify service -db orcl -service soepdb -failoverdelay 5
srvctl modify service -db orcl -service soepdb -failoverretry  60
srvctl modify service -db orcl -service soepdb -clbgoal SHORT
srvctl modify service -db orcl -service soepdb -rlbgoal SERVICE_TIME
Now a service defined for Application Continuity
srvctl add service -db orcl -service soepdb_ac -commit_outcome TRUE -retention 86400 -preferred orcl1,orcl2
srvctl modify service -db orcl -service soepdb_ac -failovertype TRANSACTION
srvctl modify service -db orcl -service soepdb_ac -failoverdelay 5
srvctl modify service -db orcl -service soepdb_ac -failoverretry  60
srvctl modify service -db orcl -service soepdb_ac -session_state STATIC
srvctl modify service -db orcl -service soepdb_ac -clbgoal SHORT
srvctl modify service -db orcl -service soepdb_ac -rlbgoal SERVICE_TIME
Then grant access to the Application Continuity package to the SOE use
SYS@//rac1/soepdb > GRANT EXECUTE ON DBMS_APP_CONT TO SOE;
And thats it for the database/grid. All we need to do now is to configure swingbench to connect to the services. You can do this either in the command line, swingbench GUI or by editing the config file. The connect string should look similar to this (for application continuity)
(DESCRIPTION=
  (TRANSPORT_CONNECT_TIMEOUT=5)
  (RETRY_COUNT=6)
  (FAILOVER=ON)
  (ADDRESS =
    (PROTOCOL = TCP)
    (HOST = racscan)
    (PORT = 1521)
  )
  (CONNECT_DATA=
    (SERVER = DEDICATED)
    (SERVICE_NAME = soepdb_ac)
  )
)
NOTE : EZConnect strings won’t work for this.
We’ll also need to use connection pooling. The pool definition is only example and should reflect the total number of threads you plan to run with. If you’ve edited the definition in the config file you should end up with something similar to
            40
            20
            60
            50
            45
            10
            120
Or if you modify it via the GUI.
The final step is to enable the application continuity driver and FAN you can again do this in the config file with the following settings
            50
            true
            20
            nodes=rac1:6200,rac2:6200
            true
or via the GUI
For my test I used the following Load configuration
        60
        0
        0
        50
        500
        120
        -1
        0:0
        5
        1000
        false
        false
        0:0
        0:0
        0
Or via the GUI
My complete config file is available here for reference
I’d initially suggest running with swingbench to enable the monitoring of errors. Start swingbench
You should see a balanced number of users logged on across your instances. Although though may fluctuate depending on a number of factors.
The next step is to cause an unexpected termination of one of the resources. I’d suggest killing PMON i.e.
[oracle@rac2 ~]$ ps -def | grep pmon
oracle    4345     1  0 05:00 ?        00:00:00 asm_pmon_+ASM2
oracle   18093     1  0 08:11 ?        00:00:00 ora_pmon_orcl2
oracle   25847  6655  0 08:37 pts/1    00:00:00 grep pmon
[oracle@rac2 ~]$ kill -9 18093
You should see a little disruption in the TPS as you kill the instance. How long will depend on your RAC configuration and power of machine. The following screen shot is from 2 VMs running on my mac. But the important point is that swingbench won’t get any errors.
To try and see what happens without application continuity try changing the connect string to point at the non application continuity service.
Then delete the property that forces swingbench to use the Application Continuity Driver.
Rerunning and terminating the instance should result in something like this.
The important point here is the errors which normally an application developer would need to handle without the guarantee of transactions not being applied more than once.
On the subject of donations
31/08/14 10:32 Filed in: Donations
Some of you may have noticed that on the side of the page I ask for donations. I haven’t been totally open about where that money goes to, so let me clear that up now. Over the years, like many people, I’ve seen the terrible pain and suffering cancer can inflict on friends and family. So all the donations that I receive via PayPal are given straight to Cancer Research UK and the British Red Cross. Clearly there’s no need to make it directly to me, you can pass it onto your local organisations.
So once again thank you to everybody that makes a donation.


So once again thank you to everybody that makes a donation.
Some simple videos on 12.1.0.2 functionality
08/08/14 12:07 Filed in: Oracle 12c
I’ve added a couple of simple youtube videos on Oracle Database 12c release 1 (12.1.0.2) functionality. I’ll be adding a few more over the new few weeks as well... Let me know what you think.
Ever so slightly embarassing
31/07/14 18:00 Filed in: Swingbench
Minor driver update to swingbench and dbtimemonitor
30/07/14 12:42 Filed in: DbtimemonitorSwingbench
New jdbc drivers for swingbench
23/07/14 12:07 Filed in: Swingbench
New build of swingbench with improved stats
13/07/14 09:23 Filed in: Swingbench
I’ve uploaded a new build of swingbench that fixes a number of bugs but also improves on the stats being produced.
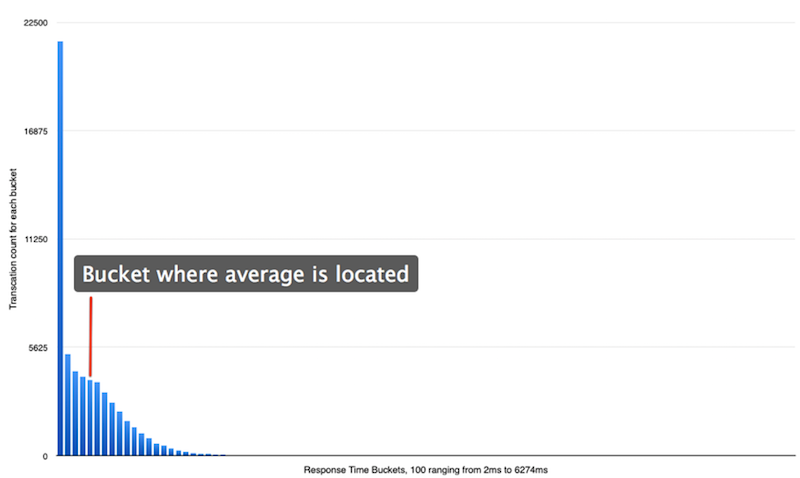
One problem with using averages when analysing results is that they hide a multitude of evils. This is particularly true for response times where there are likely to be big skews hidden if just the average is considered. You can see this in the chart below where response times are mapped into 100 buckets. The response time range from 2 to 6274 milliseconds. The average is 257ms.
It might be that in many instances the average is adequate for your needs but if your interested in the spread of results and the impact metrics like user counts, IO, memory etc have on the responsiveness of your system it might also be useful to model the spread of response so you can look for outliers.
In the latest build of swingbench when you now specify full stats collection you end up with a more complete set of results as shown below
257.86816475601097 2 6274 117.80819459762236 276.6820016426486 76552.9300329826 7.96379726468569 1.7844202125604447 14 25 43 87 170 257 354 466 636 21495, 5260, 4380, 4084, 3929, 3798, 3266, 2756, 2303, 1801, 1465, 1138, 889, 632, 499, 381, 259, 201, 140, 105, 102, 55, 43, 21, 21, 21, 17, 12, 9, 4, 5, 3, 12, 1, 6, 3, 7, 5, 1, 1, 6, 1, 2, 1, 0, 1, 0, 0, 0, 0, 0, 0, 0, 0, 0, 0, 0, 0, 0, 0, 0, 0, 0, 0, 0, 0, 0, 0, 0, 0, 0, 0, 0, 0, 0, 0, 0, 0, 0, 0, 0, 0, 0, 0, 0, 0, 0, 0, 0, 0, 0, 0, 0, 0, 0, 0, 0, 0, 0, 1 59142 0 0
I’ve included a complete set of percentiles and some additional metrics for consideration (variance, Kurtosis, Skewness, Geometric Mean). Over the coming weeks I’ll be attempting to process a results file into a more useful document.
You can enable stats collection in the UI from the preferences tab i.e.
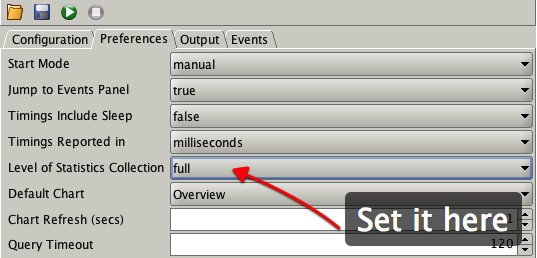
You can also set it from the command line. i.e.
./charbench -bg -s -stats full -rt 0:04 -cs //oracle12c2/orcl -a -uc 25 -com "Test of full stats collection" -intermin 2 -intermax 2 -bs 0:01 -be 0:04 &
One thing to watch out for is that you may need to change the metric that transactions are measure in i.e. from milliseconds to microseconds to model a better spread of response times.
Along side the improvements to stats I’ve also fixed the following
You can download the code front he usual place here
One problem with using averages when analysing results is that they hide a multitude of evils. This is particularly true for response times where there are likely to be big skews hidden if just the average is considered. You can see this in the chart below where response times are mapped into 100 buckets. The response time range from 2 to 6274 milliseconds. The average is 257ms.
It might be that in many instances the average is adequate for your needs but if your interested in the spread of results and the impact metrics like user counts, IO, memory etc have on the responsiveness of your system it might also be useful to model the spread of response so you can look for outliers.
In the latest build of swingbench when you now specify full stats collection you end up with a more complete set of results as shown below
I’ve included a complete set of percentiles and some additional metrics for consideration (variance, Kurtosis, Skewness, Geometric Mean). Over the coming weeks I’ll be attempting to process a results file into a more useful document.
You can enable stats collection in the UI from the preferences tab i.e.
You can also set it from the command line. i.e.
./charbench -bg -s -stats full -rt 0:04 -cs //oracle12c2/orcl -a -uc 25 -com "Test of full stats collection" -intermin 2 -intermax 2 -bs 0:01 -be 0:04 &
One thing to watch out for is that you may need to change the metric that transactions are measure in i.e. from milliseconds to microseconds to model a better spread of response times.
Along side the improvements to stats I’ve also fixed the following
- Fixed windowed stats collection (-be -bs) and full stats (-stats full) working together
- Fixed the -bg (background) option so it works on Solaris
- Numerous stability fixes
You can download the code front he usual place here
New build of swingbench
22/05/14 17:17 Filed in: Swingbench
I’ve just finished a new build of swingbench and the command line got a little bit of love. I’ve added the following new functionality
The functionality enabling you to background and the changes to the coordinator might need a little more explaining. The idea is that you might want to run up more than one load generator either because you want to create a truly tremendous load you want to run different load generators at different databases. To do this you might want to use a combination of backgrounding the load generators and using the coordinator to start,stop and report on them. For example
$ ./coordinator &$ ./charbench -cs //oracle12c/pdb1 -bg -s -uc 25 -co localhost &$ ./charbench -cs //oracle12c/pdb2 -bg -s -uc 25 -co localhost & $ ./charbench -cs //oracle12c/pdb3 -bg -s -uc 25 -co localhost &$ ./coordinator -runall$ ./coordinator -statsAggregated results for 3 load generatorsUse Ctrl-C to halt stats collection Time Users TPM TPS 17:52:03 75 3898 460 17:52:06 75 5263 483 17:52:09 75 6669 489. . .. . .$./coordinator -stopall$./coordinator -kill
Note : to background charbench you must specify -bg (it indicates the client will no longer be taking input from stdin)
You can download it as usual from here
- Added new transactions to sh benchmark
- Percentiles now report 10th to 90th percentiles instead of just 25th,50th and 75th percentile
- Added a new command line option to allow users to change stats collection target.
- Fixed the command line option “-bg” so it’s possible to background charbench
- Added new commands to coordinator to make it simpler to use
- Changed -stop to -kill to better indicate what it does
- Changed -halt to -stop to indicate what it does
- Added -stopall to stop all attached clients
- Added -runall to start all attached clients
- Added -stats to enable all display aggregated transaction rates of all attached clients
- Included python script to parse the one or more results files into csv format (located in $SWINGHOME/utils)
- forced users to specify either -create, -drop or -generate when specify character mode (-c)
The functionality enabling you to background and the changes to the coordinator might need a little more explaining. The idea is that you might want to run up more than one load generator either because you want to create a truly tremendous load you want to run different load generators at different databases. To do this you might want to use a combination of backgrounding the load generators and using the coordinator to start,stop and report on them. For example
$ ./coordinator &$ ./charbench -cs //oracle12c/pdb1 -bg -s -uc 25 -co localhost &$ ./charbench -cs //oracle12c/pdb2 -bg -s -uc 25 -co localhost & $ ./charbench -cs //oracle12c/pdb3 -bg -s -uc 25 -co localhost &$ ./coordinator -runall$ ./coordinator -statsAggregated results for 3 load generatorsUse Ctrl-C to halt stats collection Time Users TPM TPS 17:52:03 75 3898 460 17:52:06 75 5263 483 17:52:09 75 6669 489. . .. . .$./coordinator -stopall$./coordinator -kill
Note : to background charbench you must specify -bg (it indicates the client will no longer be taking input from stdin)
You can download it as usual from here