Swingbench 2.8
I’m pleased to announce the release of Swingbench 2.8. It includes A new html front end to run and review benchmark runs New tool to render results with...

Last weekend I updated swingbench to add a few features that I’ve had frequent requests for. One is the addition of database time wait event classes to be output via Charbench’s vmstat like output. You can also monitor the state of the connection pool from the command line. One other requested feature is to remove the requirement to chart/output CPU and I/O via ssh and use the database own internal data gathering. I also had some fun updating the icons for those of us lucky enough to have high DPI monitors. It’s a small thing and essentially won’t benefit anyone. It doesn’t change functionality but it was bothering me.
I’ll be honest, most of my testing in swingbench is done from the command line. I rarely use the UI unless it’s for demos, where charting something in realtime can me more compelling. So why use the command line? I do it purely because of the convenience and ability to script complex scenarios. My testing typically involves looking at improvements we’ve made in a new release of the Oracle Database and seeing what the impact is. Or seeing how a feature changes with the data size or the shape of the server. For those sort of repeatable scenarios, the command line is king. I might script ten runs to be run one after another, changing a small metric or enabling a specific feature and record the changes. Recently I added colour output to command line. Again for most people this won’t be a big change and it indeed might annoy them, but for me it adds a bit of interest to what could be just a bunch of numbers scrolling up the screen.
Taking advantage of that colour output I added three new outputs for charbench. The first is ability to monitor your connection pool usage in verbose mode “-v” with the new option “pool”. To do this you’d have command similar to the following
./charbench -cs //192.168.86.235/soe -u soe -p soe -c ../configs/SOE_Client_Side.xml -v users,trem,tps,errs,pool -intermin 0 -intermax 0 -min 0 -max 0 -uc 25 -rt 0:0.30 -dbau "sys as sysdba" -dbap secretpassword
Where the “-v users,trem,tps,errs,pool” asks charbench to show
users the users connectedtrem the time remaining in the testtps the transactions per seconderrs the error countpool the status of the connection pool
which should result in the following output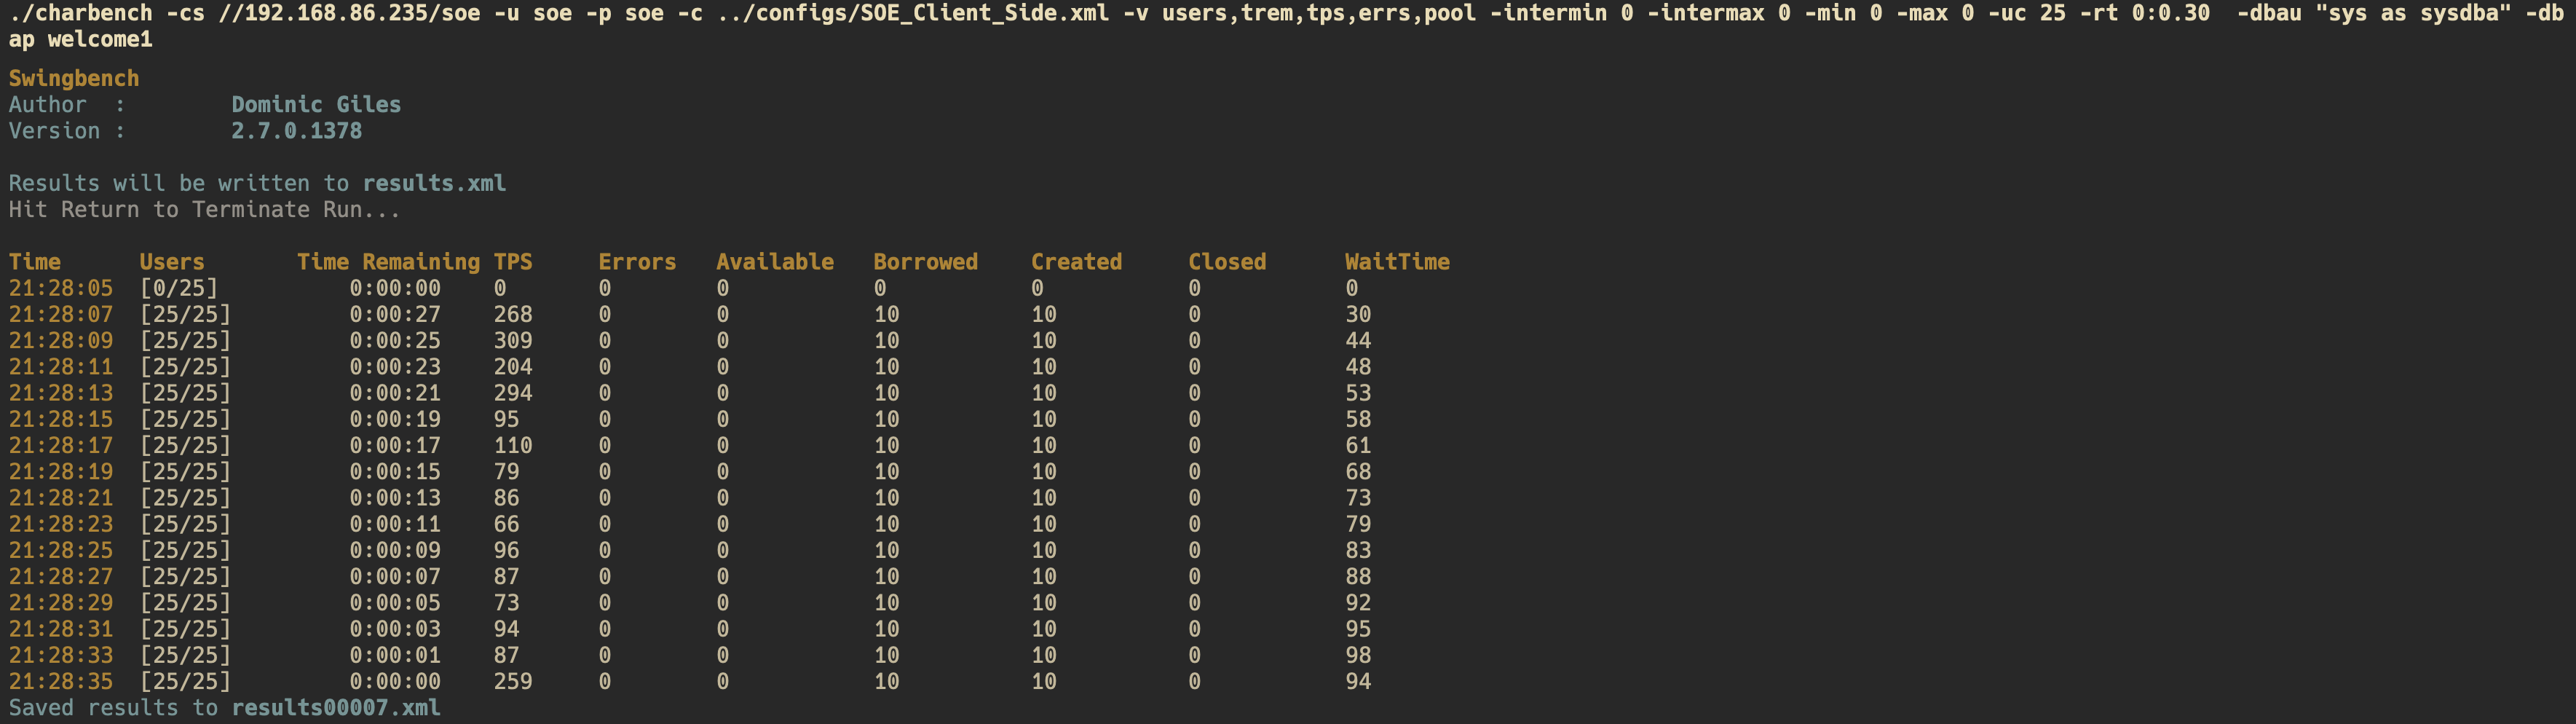 The columns show
The second new option for verbose mode “-v” is the ability to monitor the the database waitevent class for the workload you are running. This is particularly useful when tracking down problems like slow I/O, CPU contention etc. It’s just a guide, but does help you get started on what you might need to do to optimise your database and server.
Similar to the previous example you add the new option “dbtime” to the the verbose option resulting in a command line similar to
./charbench -cs //192.168.86.235/soe -u soe -p soe -c ../configs/SOE_Client_Side.xml -v users,trem,tps,errs,dbtime -intermin 0 -intermax 0 -min 0 -max 0 -uc 25 -rt 0:0.30 -dbau "sys as sysdba" -dbap secretpassword
This will result in output similar to
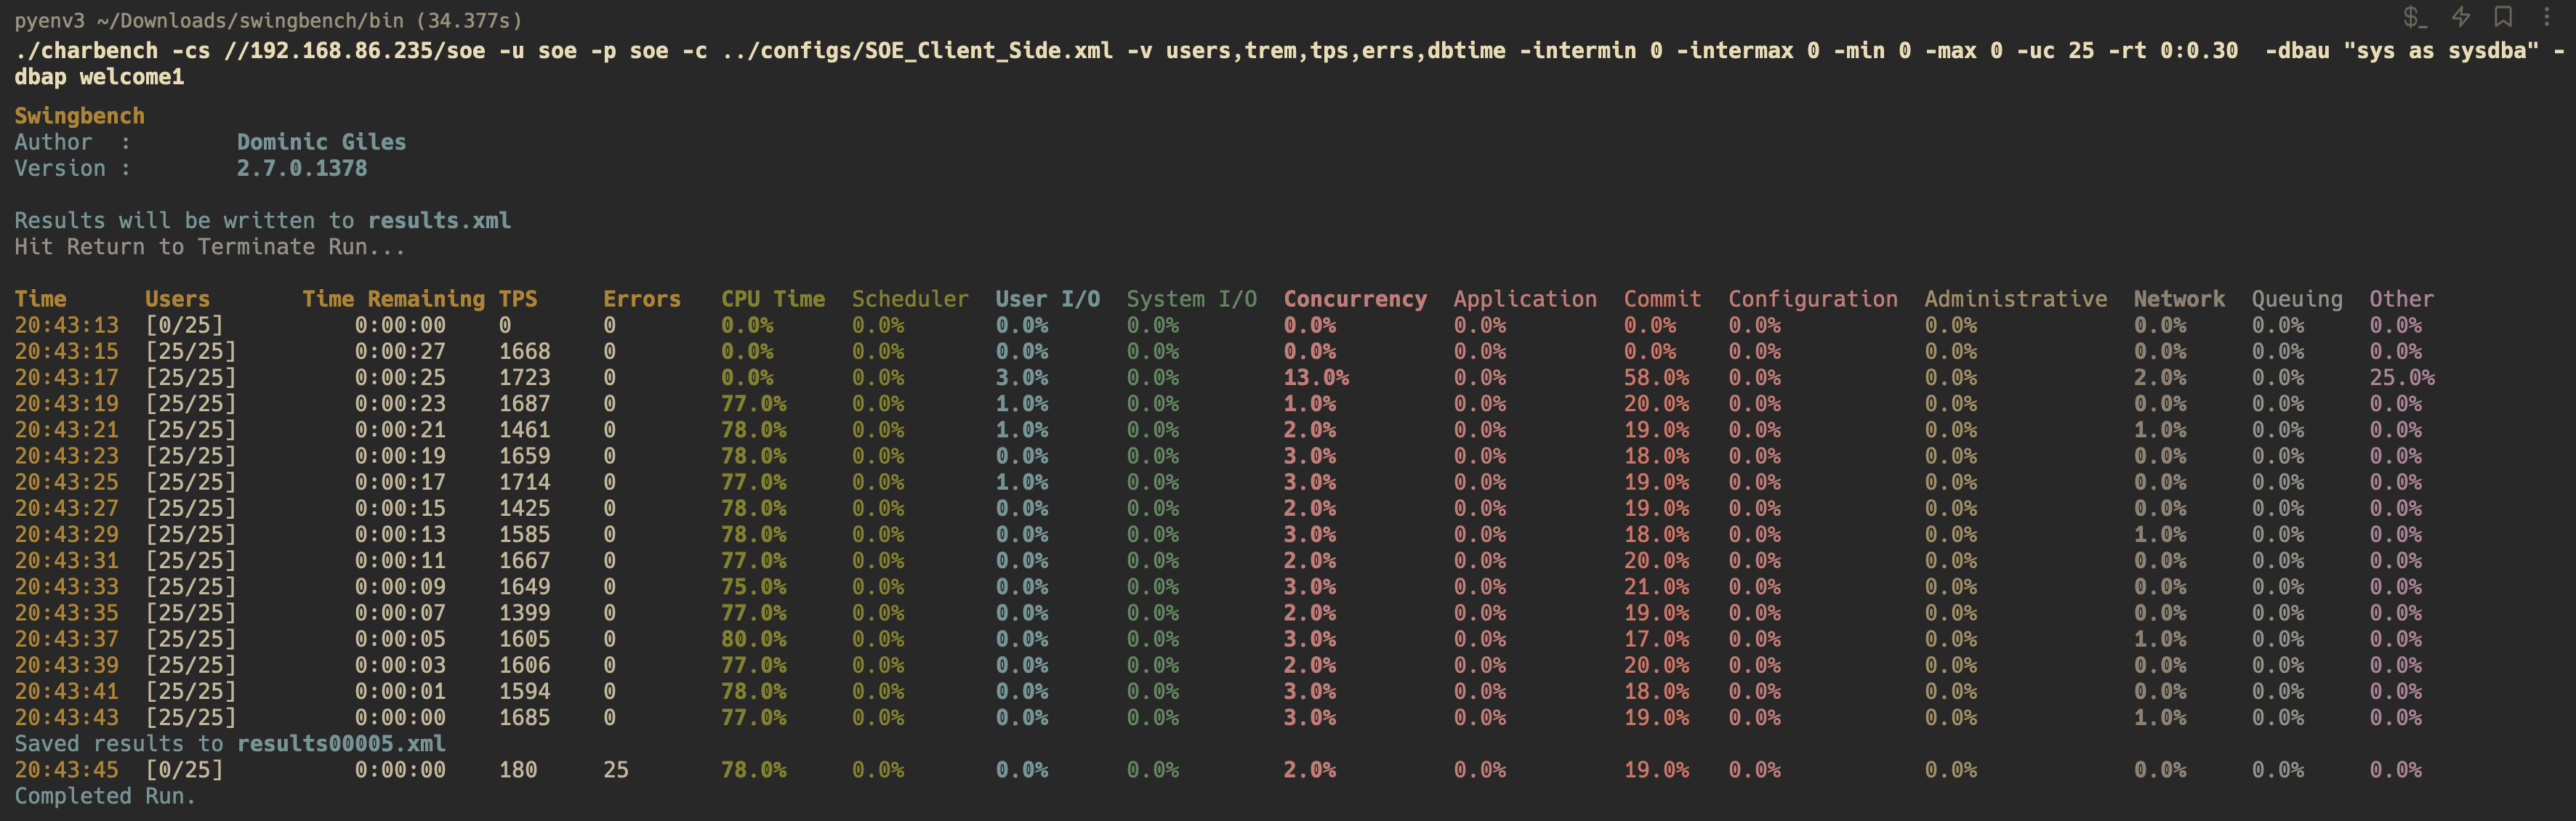 You’ll note that the output is colour coded and similar to colours used in tools that monitor Oracle Database wait events.
One feature that is long over due is removing the requirement to include ssh credentials to monitor CPU and IO on the target database. In this version swingbench gets the information from the Oracle Database target. The only thing is the need to provide admin access (user with access to the needed V$ tables).
To support this I’ve added another option for verbose “-os, which will display a set of OS stats. So the command
./charbench -cs //192.168.86.235/soe -u soe -p soe -c ../configs/SOE_Client_Side.xml -v users,trem,tps,errs,os -intermin 0 -intermax 0 -min 0 -max 0 -uc 25 -rt 0:0.30 -dbau "sys as sysdba" -dbap welcome1
will show the following
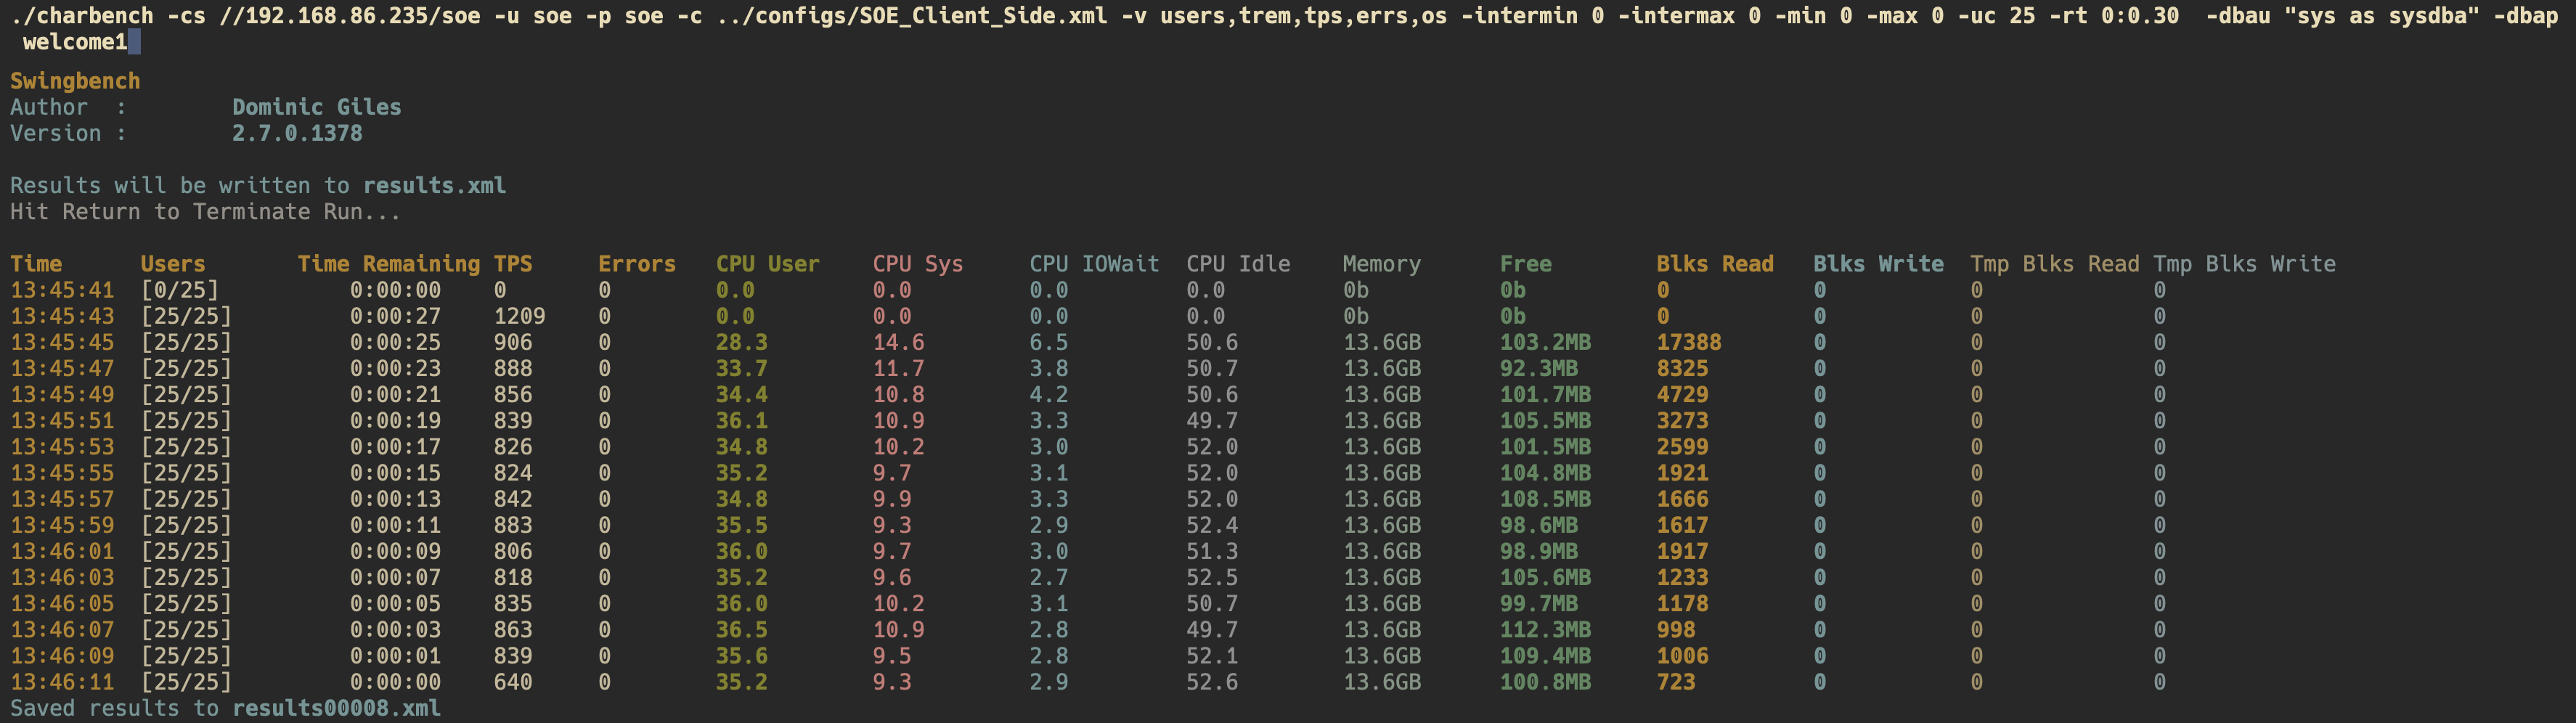
NOTE : It’s possible to turn of colour output with the -nc command line option.
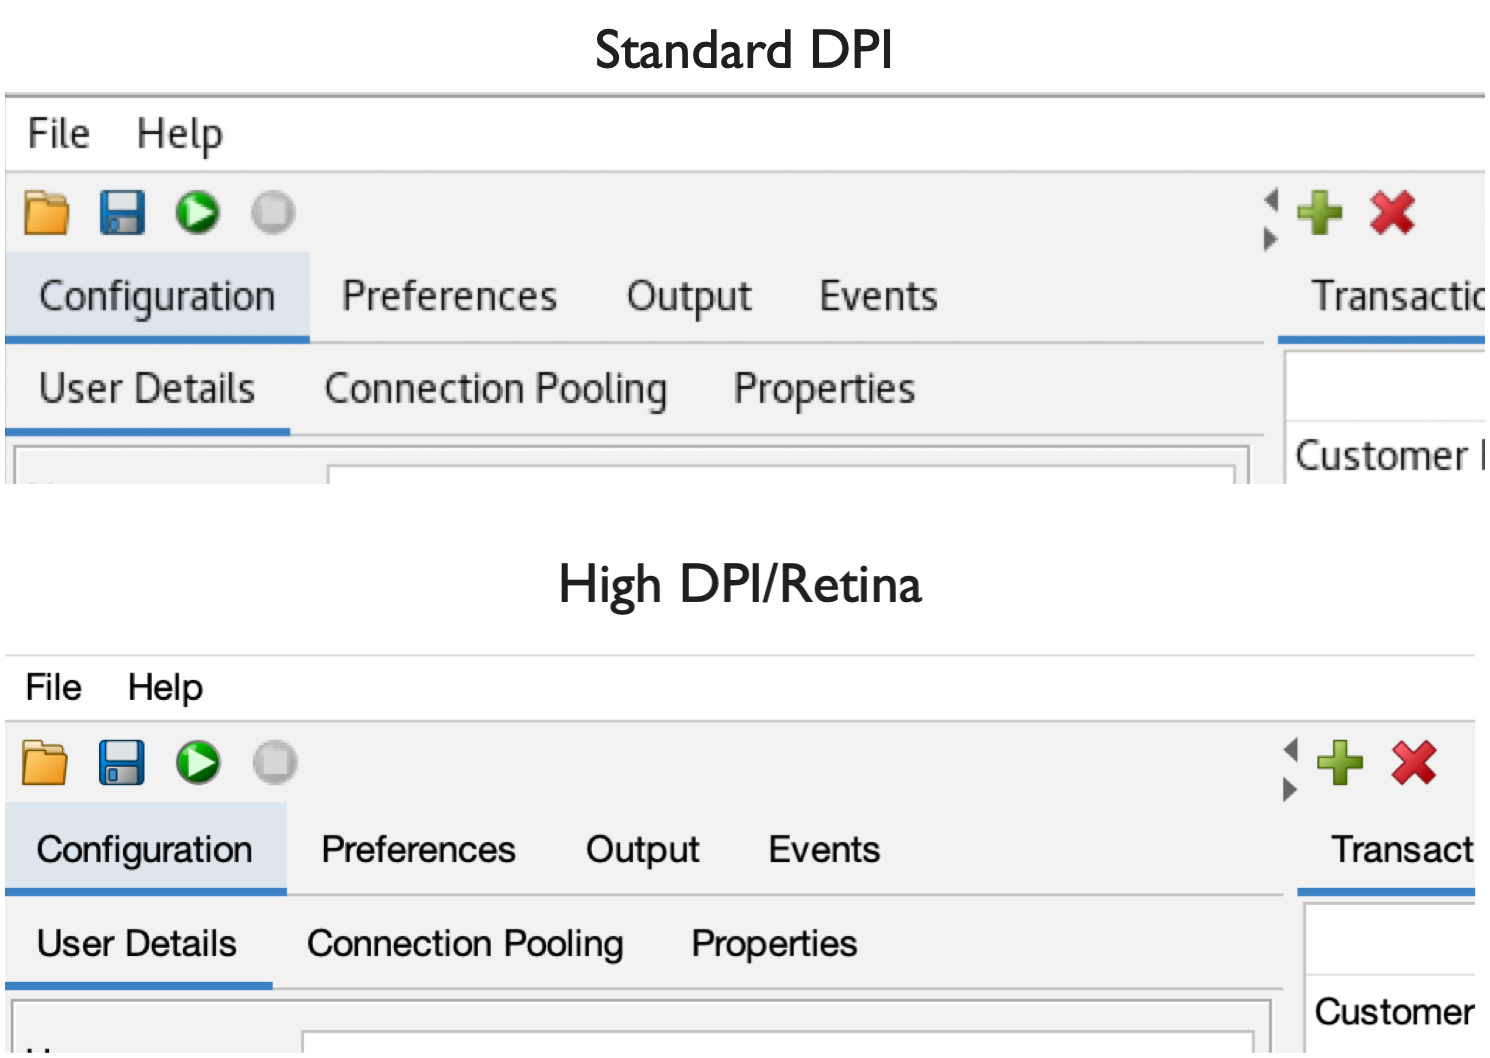
If you’re lucky enough to have a high DPI or Retina monitor one of the things you may have noticed is that the swingbench icons looked a little blurred. In this release I spent some time reworking the icons and creating multiple versions of them at different resolutions 16x16, 32x32, 64x64 pixels. Whilst most people won’t notice this change I found the exercise interesting. I’ll post the Java code needed to do this as well, it should be much easier than it is.
You can download the new version here
I’m pleased to announce the release of Swingbench 2.8. It includes A new html front end to run and review benchmark runs New tool to render results with...
I’ve added a new tool (added in September 2025) to enable you to compare benchmark results that are generated and stored in the database (see here). The tool...
There’s a new version of swingbench that includes the TPC-C benchmark and a tool to extract benchmark results from the database and export them as text or cs...
I’ve just added some functionality to Swingbench that I probably should have added a long time ago. Now, every time you run a benchmark using Charbench, Swin...
I know it’s been a while since we’ve had a swingbench update. Thats mainly because of work commitments and “life”. Thats not to say there hasn’t been work go...
A small but significant set of changes Last weekend I updated swingbench to add a few features that I’ve had frequent requests for. One is the addition of da...
A new build of Swingbench with a whole bunch of small changes mainly related to the benchmarks. Faster build time for the JSON benchmark when creating lar...
In my previous post “Going Big” I discussed the difference testing a data set of a representative size can make to the usefulness of a benchmark. Running a w...
Swingbench makes it simple to generate a dataset that you can simulate transactions against. However one of the problems I commonly see is that the users of ...
To celebrate the new release of “Oracle Database Free 23c : Developer Release” I’m releasing a new build of swingbench. This build includes a new “Movie Stre...
Swingbench 2.7 So I finally found some time to get a new build of swingbench done. The big change is that swingbench now only supports JDK-17 and above. Now,...
Hybrid Partitioned tables continues to be one of my favorite features of Oracle Database 19c and they’ve gotten better over time as we’ve introduced new feat...
Following quickly on the heels of the update to MonitorDB I’m releasing a new build of DBTimeMonitor. This is a simple update using the latest Oracle jdbc dr...
I’ve just updated MonitorDB. It’s never going to replace Grafana but if you need a quick solution to monitor a few values inside of the Oracle Database and y...
This short blog isn’t about best practices when conducting benchmarks. I think there are plenty of formal papers on the subject available with just a quick G...
I’ll make a confession. I don’t own a Microsoft Windows Machine. I never have and probably never will. This means that I generally never get the oppertunity ...
A New Release of Swingbench… Along with a new website, I’m rolling out a new build of Swingbench. This release is a little embarrassing for me, as it include...
A New Start… Quite a lot has changed since I last posted on this website. I had just left Oracle to join Google… A year and a half later I returned to Oracle...