Monitor DB
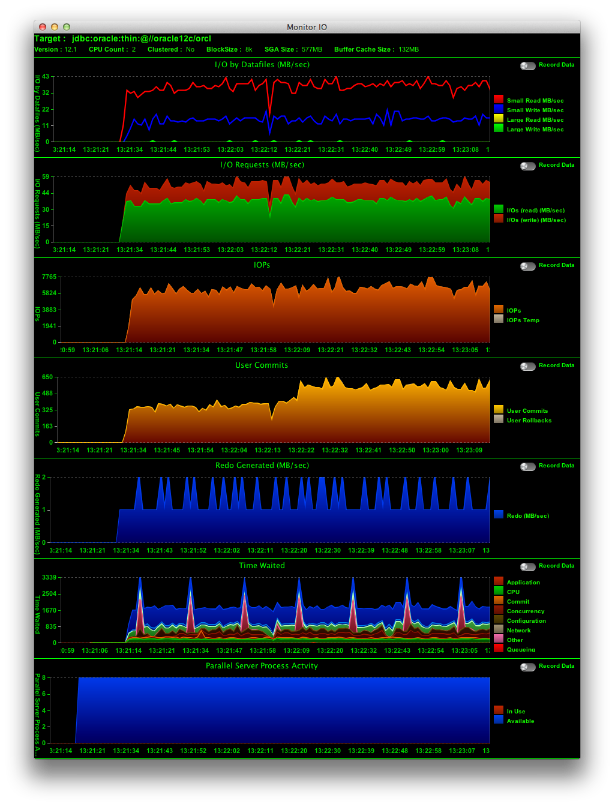
Monitor DB is a simple SQL visualisation tool that enables you to chart triplet values to a graph and record the values to a file. Whilst it is expected it will mainly monitor Database Stats it can be used to chart anything that can be selected with SQL inside of an Oracle Database.
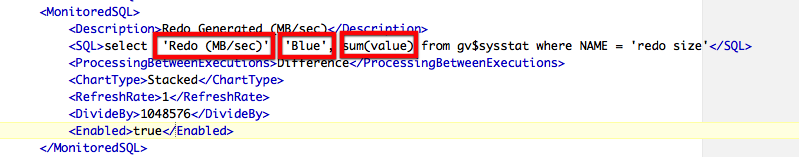
Queries are added to a simple XML file (monitordb.xml by default) in triplet form “Name of Category”, “Color”, “Value”. The first two are character strings and the second is a numerical value. “Color” can be a typical colour i.e. red, blue, green, yellow etc. or an RGB triplet of the form “color(R,G,B) ie. “color(123,123,240)” as seen here.
They can be column based triplets i.e.
select 'cat1','red', 10, 'cat2', 'blue', 20, 'cat3', 'green', 30
from dual
or row based i.e.
select 'cat1','red', 10
from dual
union
select 'cat2','blue', 20
from dual
union
select 'cat3','green', 30
from dual
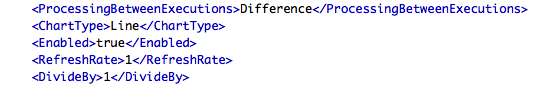
You can modify some of the attributes of the query
The
The
The
The
The
It is also possible to start recording the values displayed with the by toggling the “Record Data” button on each of the charts
The resulting data will be written to a file in the local directory.