Clusteroverview Walkthrough (2.3)
The following is a basic introduction to clusteroverview. It shows how to configure swingbench to demonstrate the scalability of a Oracle Real Application Cluster. This walkthrough uses the latest build of swingbench 2.3. Version 2.3 has had a number of changes and significantly simplifies the use of clusteroverview.This example is run against a simple 2 node cluster
Any benchmark using clusteroverview follows these steps
- Start a coordinator
- Start the load generators
- Start clusteroverview
In our example we'll start the the coordinator and load generators on the same machine and connect to the RAC instances running on their own dedicated nodes.
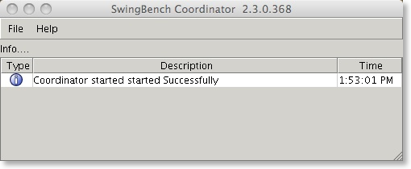
To start a coordinator issue the following command
$> ./coordinator -g
This will start the coordinator in graphical mode which is generally easier to follow.
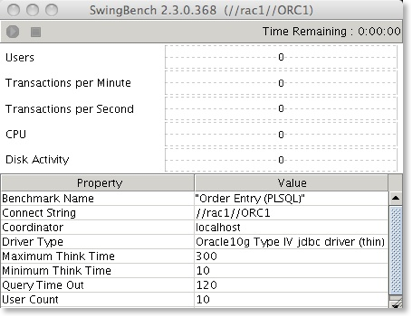
The next step is to start the load generators and attach them to the coordinator process. In this example we'll use two, one generating a load against each instance. We'll use minibench to enable us to see more clearly what each load generator is doing without taking up a significant amount of screen real estate.
To start the load generators issue the following commands
$> ./minibench -g group1 -cs //rac1/ORC1 -co localhost &
$> ./minibench -g group2 -cs //rac2/ORC2 -co localhost &
This will start two load generators similar to the one shown below
The important points to note from the commands above are
- The "-g" option specifies the group that the load generator will belong to. This is effectively the "foreign" key that joins load generators together.
- The command line options (described here) enable a single swingbench configuration file to be used as a template for all of the load generators. Here we are simply overriding the connection string.
- the "-co" option points all of the load generators at the running coordinator.
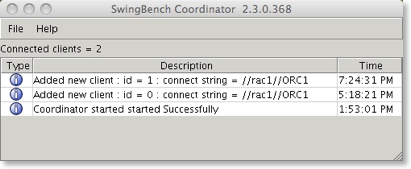
On starting the the 2 load generators the coordinator should display something similar to this
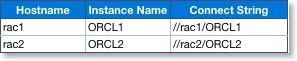
The next step is to edit the clusteroverview.xml file to reflect the environment we've created.
<?xml version = '1.0' encoding = 'UTF-8'?>
<ClusterOverviewConfiguration xmlns="http://www.dominicgiles.com/swingbench">
<Coordinator>
<HostName>localhost</HostName>
</Coordinator>
<Preferences>
<MonitoredUsers>cc,soe</MonitoredUsers>
<RefreshPeriod>2</RefreshPeriod>
<StartInOrder>false</StartInOrder>
<StabilitySamples>10</StabilitySamples>
<StabilityTolerance>2</StabilityTolerance>
</Preferences>
<MonitoredNodes>
<MonitoredNode>
<GroupId>group1</GroupId>
<DisplayName>RAC Node1</DisplayName>
<ConnectString>//rac1/ORCL1/ConnectString>
</MonitoredNode>
<MonitoredNode>
<GroupId>group2</GroupId>
<DisplayName>RAC Node2</DisplayName>
<ConnectString>//rac2/ORCL2/ConnectString>
</MonitoredNode>
<DBAUsername>system</DBAUsername>
<DBAPassword>manager</DBAPassword>
<DBADriverType>thin</DBADriverType>
</MonitoredNodes>
<DisplayedCharts>
<DisplayedChart>
<ChartName>ControlPanel</ChartName>
</DisplayedChart>
<DisplayedChart>
<ChartName>Scalability</ChartName>
<Autoscale>false</Autoscale>
<MaximumValue>120</MaximumValue>
</DisplayedChart>
<DisplayedChart>
<ChartName>Overview</ChartName>
</DisplayedChart>
<DisplayedChart>
<ChartName>UserConnections</ChartName>
<Autoscale>false</Autoscale>
<MaximumValue>50</MaximumValue>
</DisplayedChart>
</DisplayedCharts>
</ClusterOverviewConfiguration>
Modify the "<MonitoredNode>" sections to reflect the two RAC instances we will be generating the load against. The "<GroupId>" attribute should reflect the value we defined for the load generator pointing at the instance. The "<DisplayName>" attribute will be the value shown within the clusteroverview charts. The "<ConnectString>" attribute will typically be the same connect string used by the load generators. One other point to note is that clusteroverview also now supports auto-scaling and maximum values for charts, this can sometimes make charting information such as scalability clearer. These attributes are illustrated in the clusteroverview.xml file above.
Clusteroverview is started using the following command
$> ./clusteroverview
This will start the following application
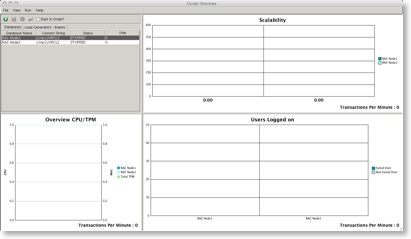
To test scalability the start in order checkbox needs to be selected
This ensures that the nodes are started in order and enables the checkpointing of results at various stages. The next step is to press the start button.
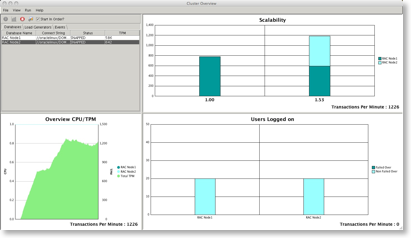
This will start the first swingbench load generator. Once the load has stabilized press the chart button
This will benchmark the current load and the first bar in the the scalability chart will be fixed. The status of the database will change to "SNAPPED" in the control panel. The control panel will also move the highlighted row to the next database entry. Simply press start again to activate the next load generator, when this has stabilized press the chart button again and the scalability chart will display the increase (ratio) in transactions between each snap.
To close the load generators goto the coordinator menu and select "Exit and halt all attached load generators". This will shutdown the attached load generators and coordinator.